The Chicago Blackhawks reached the 30-game mark, and for the first time this season they finished a 10-game segment below .500, posting a 3-5-2 record. It was a stretch split evenly between home and road games, but the results were far from even.
On the road, Chicago went 1-3-1 and gave up 27 goals, including outings where they allowed 6, 7, and 9 goals. Those three games alone accounted for 22 goals against and became the turning point of this difficult 10-game run. At home, the story was the opposite: a 2-2-1 record and only 12 goals against, showing far more structure and control.
Offensively, Connor Bedard continued to drive the team with 13 points, while Tyler Bertuzzi added 6 goals and 9 points, giving the Blackhawks the scoring punch they needed in tight moments. In net, Spencer Knight delivered another strong segment with three wins, keeping Chicago competitive despite the defensive lapses in front of him.
In this article, we continue our breakdown of the Blackhawks’ season through 10-game trenches—reviewing team trends, advanced stats, and individual performance. Each player is graded from A to D, and we track how their totals evolve across each segment to give a clear picture of who is rising, who is slipping, and what it all means moving forward.
Team Stats
| Category | Season 2025-26 | Game 1–10 | Game 11–20 | Game 21–30 | NHL Rank |
| Record | 13-11-6 | 5-3-2 | 5-3-2 | 3-5-2 | 20th |
| GF (Goals For) | 89 | 33 | 33 | 23 | 22nd |
| GF/GP | 2.97 | 3.30 | 3.30 | 2.30 | 20th |
| GA (Goals Against) | 91 | 25 | 27 | 39 | 14th |
| GA/GP | 3.03 | 2.50 | 2.55 | 3.90 | 16th |
| GD (Goal Differential) | -2 | 8 | 6 | -16 | 22nd |
| PP (Power Play %) | 24.1% | 18.2% | 32.0% | 18.8% | 10th |
| PK (Penalty Kill %) | 83.56% | 86.4% | 79.4% | 84.4% | 8th |
| FOW (Faceoff %) | 46.3% | 47.6% | 45.2% | 46.3% | 29th |
| S/GP (Shots per Game) | 25.0 | 24.5 | 25.5 | 26.1 | 29th |
| SA/GP (Shots Against per Game) | 31.0 | 29.4 | 32.6 | 29.7 | 29th |
| Shots % | 11.7 | 11.2 | 12.9 | 8.8 | 6th |
| NETPEN (Net Penalties) | -14 | -12 | -15 | 0 | 32nd |
| MINOR (Minor Penalties) | 75 | 48 | 27 | 33 | 10th |
| GF 5v5 | 46 | 24 | 22 | 15 | 10th |
| GA 5v5 | 34 | 17 | 17 | 32 | 5th |
| CF% (Corsi For %) | 46.167% | 46.7% | 44.1% | 46.87% | 29th |
| xGF% (Expected Goals For %) | 44.11% | 45.3% | 43.4% | 42.45% | 31st |
| HDCF% (High-Danger Scoring Chances For %) | 42.12% | 43.3% | 41.5% | 40.63% | 31st |
| HDCF-HDCA (Differential) | 230-316 | 95-137 | 78-81 | 57-105 | —— |
Graphic 1 — Goals Against per Game (10-Game Segments)
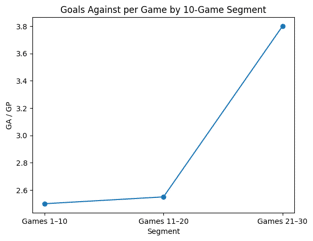
This graphic highlights where the Blackhawks’ defensive issues escalated. After holding opponents under control in the first two 10-game segments, goals against spiked to nearly four per game in Games 21–30. That surge explains the poor results during this stretch, especially on the road, where defensive breakdowns became far more frequent.
Graphic 2 — Shooting Percentage by 10-Game Segment
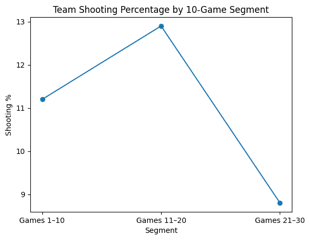
Despite a slight increase in shot volume, the Blackhawks’ shooting percentage dropped sharply in the last 10 games. This decline reflects a lack of finishing and a drop in shot quality, with fewer chances generated from high-danger areas. It underscores the gap between simply taking shots and creating meaningful scoring opportunities.
Graphic 3 — High-Danger Chances: For vs Against
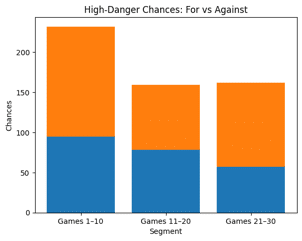
High-danger chances tell the clearest story of this 10-game stretch. After nearly breaking even in Games 11–20, the Blackhawks were heavily outmatched in Games 21–30, allowing far more Grade-A chances than they generated. Losing the slot battle at this level makes winning consistently impossible and directly contributed to the rise in goals against and declining analytics.
What the Numbers Tell Us
The numbers clearly show that the Blackhawks went through a rough 10-game stretch, with noticeable drops across multiple categories. Allowing nearly four goals per game during this segment made it extremely difficult to stay competitive, especially on the road. Defensive breakdowns, combined with extended time spent in their own zone, put constant pressure on the group and their goaltenders.
Special teams also took a step back. The power play cooled off significantly, failing to provide momentum at key moments, while the penalty kill managed to hold its ground, remaining one of the few areas that stayed relatively stable during this stretch.
At five-on-five, the picture was not much better. While the team slightly increased its shots per game and reduced shots against, their shooting percentage dropped by nearly four percent, highlighting a lack of finish and quality looks. That trend is reinforced by the underlying analytics, as the Blackhawks ranked near the bottom of the league in xGF%, HDCF%, and overall shot quality during this segment.
Simply put, this was a team that struggled for a full 10-game period—in structure, execution, and consistency. The challenge now is clear: tighten up defensively, reclaim the middle of the ice, and find ways to generate higher-quality offense. A bounce-back is not optional; it’s necessary.
All Situations
Records
| Situation | Overall | Home | Away |
| Record | 13-11-6 | 7-5-3 | 6-6-3 |
| When Scoring First | 12-4-3 | 6-3-3 | 6-1-0 |
| When Opponent Scores First | 1-7-3 | 1-2-0 | 0-5-3 |
| When Outshooting Opponent | 5-2-3 | 3-1-2 | 2-1-1 |
| When Outshot by Opponent | 8-9-3 | 4-4-1 | 4-5-2 |
| 1-Goal Games | 4-5-6 | 2-4-3 | 2-1-3 |
| After 1st Period – Lead | 4-2-2 | 2-2-2 | 2-0-0 |
| After 1st Period – Trail | 1-4-0 | 1-0-0 | 0-4-0 |
| After 1st Period – Tie | 8-5-4 | 4-3-1 | 4-2-3 |
| After 2nd Period – Lead | 8-1-1 | 4-1-1 | 4-0-0 |
| After 2nd Period – Trail | 1-8-1 | 1-3-0 | 0-5-1 |
| After 2nd Period – Tie | 4-2-4 | 2-1-2 | 2-1-2 |
Scoring by Period
| OVERALL | 1st | 2nd | 3rd | OT | Total |
| Team | 21 | 26 | 41 | 1 | 89 |
| Opponent | 17 | 37 | 31 | 4 | 89 |
| HOME | 1st | 2nd | 3rd | OT | Total |
| Team | 11 | 14 | 18 | 1 | 44 |
| Opponent | 4 | 17 | 13 | 2 | 36 |
| AWAY | 1st | 2nd | 3rd | OT | Total |
| Team | 10 | 12 | 23 | 0 | 45 |
| Opponent | 13 | 20 | 18 | 2 | 53 |
Shots by Period
| Overall | 1st | 2nd | 3rd | OT | Total |
| Team | 271 | 232 | 244 | 16 | 763 |
| Opponent | 297 | 310 | 293 | 19 | 919 |
| Home | 1st | 2nd | 3rd | OT | Total |
| Team | 147 | 102 | 121 | 6 | 376 |
| Opponent | 125 | 139 | 135 | 12 | 411 |
| Away | 1st | 2nd | 3rd | OT | Total |
| Team | 124 | 130 | 123 | 10 | 387 |
| Opponent | 172 | 171 | 158 | 7 | 508 |
What the Numbers Tell Us
Taken together, these numbers paint a very clear picture of the Blackhawks through the first 30 games: this is a team that can compete when conditions are right, but struggles badly when they fall behind or lose control of the game flow.
1️⃣ Situational Play: A Team That Needs the First Punch
The situational record shows a strong dependency on scoring first.
- 12-4-3 when scoring first
- 1-7-3 when allowing the first goal
This gap is significant. When Chicago scores first, they can settle into their structure and manage games. When they fall behind, they struggle to chase, often opening themselves up defensively.
The same pattern appears with shot control:
- 5-2-3 when outshooting opponents
- 8-9-3 when outshot
The Blackhawks are far more effective when they dictate pace. When opponents control shot volume, Chicago spends too much time defending and loses its identity.
2️⃣ Period-by-Period Results: Third Period Strength, Early Vulnerability
Scoring by period tells a very important story.
- The Blackhawks scored 41 goals in the third period, their best frame by far.
- However, they were outscored badly in the second period (37 GA).
This suggests a team that:
- Adjusts well late in games
- Competes hard when trailing or protecting a lead
- But often struggles with second-period structure, line changes, and defensive reads
Despite strong third periods, early and middle-game lapses often force Chicago into comeback mode.
3️⃣ Shots by Period: Consistent Deficit, Especially on the Road
Shot totals reinforce the underlying problem.
- 763 shots for vs 919 shots against (–156 differential)
- At home: much closer (376 vs 411)
- On the road: severe deficit (387 vs 508)
This shows:
- Chicago can manage play at home
- On the road, opponents control possession and pace
- Road games lead to extended defensive-zone time and breakdowns
Even when shot totals improve slightly late in games, much of the damage is already done earlier.
4️⃣ Game-State Performance: Protecting Leads vs Chasing Games
The period-state records are very telling:
- After 2nd period – Lead: 8-1-1
- After 2nd period – Trail: 1-8-1
When the Blackhawks enter the third period with a lead, they are excellent at closing games. When they trail, they rarely recover. This reinforces the idea that this team is still learning how to generate offense without opening itself up defensively.
5️⃣ One-Goal Games: Competitive but Inconsistent
- 4-5-6 in one-goal games
Chicago stays close, but does not consistently execute in tight moments. This is typical of a young team still developing composure, puck management, and situational awareness late in games.
6️⃣ Overall Identity Through 30 Games
All these numbers point to the same conclusion:
- The Blackhawks are structured and effective when playing from ahead
- They struggle badly when forced to chase games
- Road games expose defensive weaknesses
- Shot quality and possession remain major issues
- Late-game competitiveness is there, but damage often happens earlier
This is not a lack-of-effort team. It’s a team still learning how to manage games at the NHL level, especially in difficult environments.
The data confirms that the Blackhawks’ recent struggles were not random. They were the result of losing control of game flow—falling behind early, giving up too many shots, and spending too much time defending. When Chicago plays on its terms, the results are competitive. The next step is learning how to stay disciplined and structured when the game doesn’t go their way.
Players Stats
Connor Bedard
| Player | Pos | GP | TOI (AVG) | G | A | PTS | +/- | xGF% | GF% |
| Connor Bedard | C | 30 | 21:04 | 19 | 23 | 42 | 8 | 44.8 | 53.85 |
| Game 1–10 | 10 | 5 | 6 | 11 | 6 | ||||
| Game 11–20 | 10 | 8 | 10 | 18 | 2 | ||||
| Game 21-30 | 10 | 6 | 7 | 13 | 0 |
Frank Nazar
| Player | Pos | GP | TOI (AVG) | G | A | PTS | +/- | xGF% | GF% |
| Frank Nazar | C | 28 | 18:55 | 5 | 15 | 20 | -1 | 39.51 | 48.39 |
| Game 1–10 | 10 | 5 | 6 | 11 | 6 | ||||
| Game 11–20 | 8 | 0 | 3 | 3 | -1 | ||||
| Game 21-30 | 10 | 0 | 6 | 6 | -6 |
Ryan Donato
| Player | Pos | GP | TOI (AVG) | G | A | PTS | +/- | xGF% | GF% |
| Ryan Donato | RW | 30 | 15:09 | 8 | 5 | 13 | -6 | 47.92 | 45.16 |
| Game 1–10 | 10 | 6 | 2 | 8 | 2 | ||||
| Game 11–20 | 10 | 1 | 3 | 4 | -1 | ||||
| Game 21-30 | 10 | 1 | 0 | 1 | -7 |
Teuvo Teravainen
| Player | Pos | GP | TOI (AVG) | G | A | PTS | +/- | xGF% | GF% |
| Teuvo Teravainen | RW | 29 | 19:07 | 6 | 11 | 17 | 1 | 36.94 | 46.43 |
| Game 1–10 | 10 | 1 | 7 | 8 | 6 | ||||
| Game 11–20 | 10 | 4 | 3 | 7 | 2 | ||||
| Game 21-30 | 9 | 1 | 1 | 2 | -7 |
Andrei Burakovsky
| Player | Pos | GP | TOI (AVG) | G | A | PTS | +/- | xGF% | GF% |
| Andrei Burakovsky | LW | 25 | 17:09 | 7 | 12 | 19 | 0 | 46.63 | 55.0 |
| Game 1–10 | 9 | 2 | 4 | 6 | -1 | ||||
| Game 11–20 | 9 | 5 | 4 | 9 | 6 | ||||
| Game 21-30 | 7 | 0 | 4 | 4 | -5 |
Tyler Bertuzzi
| Player | Pos | GP | TOI (AVG) | G | A | PTS | +/- | xGF% | GF% |
| Tyler Bertuzzi | LW | 26 | 18:46 | 16 | 10 | 26 | -1 | 46.59 | 48.84 |
| Game 1–10 | 9 | 2 | 4 | 6 | 0 | ||||
| Game 11–20 | 7 | 8 | 3 | 11 | 1 | ||||
| Game 21-30 | 10 | 6 | 3 | 9 | -2 |
Ilya Mikheyev
| Player | Pos | GP | TOI (AVG) | G | A | PTS | +/- | xGF% | GF% |
| Ilya Mikheyev | RW | 28 | 17:44 | 4 | 3 | 7 | -4 | 40.39 | 36.36 |
| Game 1–10 | 9 | 3 | 2 | 5 | 5 | ||||
| Game 11–20 | 9 | 1 | 1 | 2 | 0 | ||||
| Game 21-30 | 10 | 0 | 0 | 0 | -9 |
Louis Crevier
| Player | Pos | GP | TOI (AVG) | G | A | PTS | +/- | xGF% | GF% |
| Louis Crevier | D | 29 | 14:17 | 3 | 8 | 11 | 7 | 40.38 | 36.36 |
| Game 1–10 | 9 | 2 | 2 | 4 | 4 | ||||
| Game 11–20 | 10 | 0 | 6 | 6 | 4 | ||||
| Game 21-30 | 10 | 1 | 0 | 1 | -2 |
Nick Foligno
| Player | Pos | GP | TOI (AVG) | G | A | PTS | +/- | xGF% | GF% |
| Nick Foligno | RW | 15 | 14:42 | 0 | 6 | 6 | 2 | 54.2 | 50.0 |
| Game 1–10 | 7 | 0 | 4 | 4 | -1 | ||||
| Game 11–20 | 8 | 0 | 2 | 2 | 3 | ||||
| Game 21-30 | 0 | INJURY |
Colton Dach
| Player | Pos | GP | TOI (AVG) | G | A | PTS | +/- | xGF% | GF% |
| Colton Dach | LW | 20 | 12:13 | 3 | 3 | 6 | -11 | 38.67 | 27.27 |
| Game 1–10 | 10 | 1 | 2 | 3 | -3 | ||||
| Game 11–20 | 10 | 1 | 0 | 1 | -3 | ||||
| Game 21-30 | 10 | 1 | 1 | 2 | -5 |
Jason Dickinson
| Player | Pos | GP | TOI (AVG) | G | A | PTS | +/- | xGF% | GF% |
| Jason Dickinson | C | 17 | 15:13 | 2 | 3 | 5 | -5 | 46.86 | 31.82 |
| Game 1–10 | 7 | 1 | 2 | 3 | 1 | ||||
| Game 11–20 | 1 | 0 | 0 | 0 | -2 | ||||
| Game 21-30 | 9 | 1 | 1 | 2 | -6 |
Sam Rinzel
| Player | Pos | GP | TOI (AVG) | G | A | PTS | +/- | xGF% | GF% |
| Sam Rinzel | D | 28 | 16:32 | 1 | 7 | 8 | 0 | 44.51 | 50.0 |
| Game 1–10 | 10 | 1 | 2 | 3 | 3 | ||||
| Game 11–20 | 9 | 0 | 1 | 1 | 2 | ||||
| Game 21-30 | 9 | 0 | 4 | 4 | -5 |
Alex Vlasic
| Player | Pos | GP | TOI (AVG) | G | A | PTS | +/- | xGF% | GF% |
| Alex Vlasic | D | 29 | 21:14 | 2 | 3 | 5 | -7 | 40.6 | 39.02 |
| Game 1–10 | 9 | 0 | 3 | 3 | 0 | ||||
| Game 11–20 | 10 | 0 | 0 | 0 | -6 | ||||
| Game 21-30 | 10 | 1 | 0 | 1 | -7 |
Artyom Levshunov
| Player | Pos | GP | TOI (AVG) | G | A | PTS | +/- | xGF% | GF% |
| Artyom Levshunov | D | 29 | 16:47 | 1 | 13 | 14 | 0 | 44.89 | 50.0 |
| Game 1–10 | 9 | 0 | 3 | 3 | 3 | ||||
| Game 11–20 | 10 | 0 | 8 | 8 | -3 | ||||
| Game 21-30 | 10 | 1 | 2 | 3 | -4 |
Ryan Greene
| Player | Pos | GP | TOI (AVG) | G | A | PTS | +/- | xGF% | GF% |
| Ryan Greene | C | 30 | 16:13 | 4 | 6 | 10 | 6 | 44.32 | 60.0 |
| Game 1–10 | 10 | 1 | 1 | 2 | 1 | ||||
| Game 11–20 | 10 | 1 | 2 | 3 | 3 | ||||
| Game 21-30 | 10 | 2 | 3 | 5 | 2 |
Matt Grzelcyk
| Player | Pos | GP | TOI (AVG) | G | A | PTS | +/- | xGF% | GF% |
| Matt Grzelcyk | D | 30 | 15:50 | 0 | 5 | 5 | 7 | 48.75 | 57.14 |
| Game 1–10 | 10 | 0 | 2 | 2 | 4 | ||||
| Game 11–20 | 10 | 0 | 2 | 2 | 5 | ||||
| Game 21-30 | 10 | 0 | 1 | 1 | -2 |
Wyatt Kaiser
| Player | Pos | GP | TOI (AVG) | G | A | PTS | +/- | xGF% | GF% |
| Wyatt Kaiser | D | 30 | 19:16 | 1 | 4 | 5 | 2 | 43.33 | 50.0 |
| Game 1–10 | 10 | 0 | 2 | 2 | 4 | ||||
| Game 11–20 | 10 | 0 | 1 | 1 | 6 | ||||
| Game 21-30 | 10 | 1 | 1 | 2 | -8 |
Connor Murphy
| Player | Pos | GP | TOI (AVG) | G | A | PTS | +/- | xGF% | GF% |
| Connor Murphy | D | 30 | 14:58 | 0 | 3 | 3 | -5 | 44.89 | 38.10 |
| Game 1–10 | 10 | 0 | 0 | 0 | -2 | ||||
| Game 11–20 | 10 | 0 | 3 | 3 | 1 | ||||
| Game 21-30 | 10 | 0 | 0 | 0 | -4 |
Landon Slaggert
| Player | Pos | GP | TOI (AVG) | G | A | PTS | +/- | xGF% | GF% |
| Landon Slaggert | LW | 10 | 9:04 | 1 | 0 | 1 | 0 | 58.37 | 50.0 |
| Game 1–10 | 3 | 0 | 0 | 0 | -1 | ||||
| Game 11–20 | 5 | 1 | 0 | 1 | 1 | ||||
| Game 21-30 | 2 | 0 | 0 | 0 | 0 |
Sam Lafferty
| Player | Pos | GP | TOI (AVG) | G | A | PTS | +/- | xGF% | GF% |
| Sam Lafferty | C | 12 | 8:52 | 1 | 0 | 1 | 0 | 41.23 | 50.0 |
| Game 1–10 | 3 | 0 | 0 | 0 | 0 | ||||
| Game 11–20 | 5 | 1 | 0 | 1 | 1 | ||||
| Game 21-30 | 4 | 0 | 0 | 0 | -1 |
Oliver Moore
| Player | Pos | GP | TOI (AVG) | G | A | PTS | +/- | xGF% | GF% |
| Oliver Moore | C | 18 | 0:13:04 | 3 | 5 | 8 | -2 | 52.74 | 45.83 |
| Game 1–10 | 0 | 0 | 0 | 0 | 0 | ||||
| Game 11–20 | 8 | 2 | 3 | 5 | 2 | ||||
| Game 21-30 | 10 | 1 | 2 | 3 | -4 |
Goalies
| Player | Pos | GP | Record | GAA | SV% | GSAx |
| Spencer Knight | G | 21 | 10-6-5 | 2.50 | 0.916 | 8.8 |
| Game 1–10 | 7 | 4-2-1 | 2.11 | 0.930 | 8.8 | |
| Game 11–20 | 7 | 3-2-2 | 2.83 | 0.915 | 8.8 | |
| Game 21-30 | 7 | 3-2-2 | 2.55 | 0.902 | ||
| A.Söderblom | G | 9 | 3-5-1 | 3.92 | 0.877 | 0.7 |
| Game 1–10 | 3 | 1-1-1 | 3.01 | 0.888 | 0.7 | |
| Game 11–20 | 3 | 2-1-0 | 2.03 | 0.932 | 0.7 | |
| Game 21-30 | 3 | 0-3-0 | 6.71 | 0.823 |
How Player Grades Are Determined
Each player’s grade is based on a combination of individual performance, consistency, impact on the team, and role execution through the first 10 games of the 2025–26 season.
Here’s how the evaluation works:
• Statistics & Analytics: Goals, assists, points, plus/minus, time on ice, faceoff %, possession numbers (CF%, xGF%), and situational play such as power play and penalty kill usage.
• Role & Expectation: Players are judged relative to their role — a rookie or third-pair defenseman won’t be evaluated the same way as a top-line center or starting goalie.
• Consistency & Game Impact: Effort, decision-making, and performance shift to shift. Players who make key plays or respond in big moments earn higher marks.
• Coaching Trust & Usage: Ice time, matchups, and the coach’s confidence in the player during key situations reflect how reliable they’ve been.
• Growth & Development: For younger players, improvement, adaptation to the NHL pace, and maturity are important factors.
Grades range from A (Outstanding) to D (Poor) — with B representing solid, reliable play and C meaning room for improvemen
Players Grades:
| Player | Game 21 – 30 | Game 11 – 20 | Game 1 – 10 |
| Connor Bedard | A+ | A+ | A+ |
| Frank Nazar | C+ | B- | A |
| Tyler Bertuzzi | A | A | B |
| Ryan Donato | C | B- | B+ |
| Ilya Mikheyev | C | B- | A- |
| Andrei Burakovsky | B | A | B |
| Teuvo Teravainen | B- | B | B+ |
| Colton Dach | C | C | C |
| Jason Dickinson | C+ | C | C |
| Ryan Greene | B | B | C |
| Nick Foligno | —— INJURY | C | C |
| Sam Lafferty | C- | C | D |
| Landon Slaggert | C- | C- | C- |
| Oliver Moore | B- | B | —- AHL |
| DEFENSE | |||
| Player | Game 11 – 20 | Game 1 – 10 | |
| Alex Vlasic | B | B | B+ |
| Sam Rinzel | C- | C | B |
| Wyatt Kaiser | B- | B | B- |
| Connor Murphy | C | C+ | C |
| Matt Grzelchyk | C | B- | C |
| Artyom Levshunov | B- | B | C |
| Louis Crevier | B | B- | C+ |
| Goalies | Game 11 – 20 | Game 1 – 10 | |
| Spencer Knight | A | A | A+ |
| Arvid Soderblom | D | B- | C |
| COACH | |||
| Name | Game 21 – 30 | Game 11 – 20 | Game 1 – 10 |
| Jeff Blashill | B- | B+ | B+ |
Player Performance Assessment – Last 10 Games
Despite the team’s struggles during this 10-game stretch, a few players clearly stood out and carried the load, while others were heavily impacted by the defensive breakdowns and blowout losses.
Top Performers
Connor Bedard continued to lead the offense and was the most consistent forward during this stretch. He recorded 13 points, including 6 goals, and remained the driving force every night, even when the team was chasing games. His production came despite tougher matchups and limited offensive support at times.
Tyler Bertuzzi was equally important, contributing 6 goals and 9 points. He provided finishing around the net and was one of the few forwards able to capitalize on limited high-quality chances. When the Blackhawks needed offense, Bertuzzi was often involved.
Spencer Knight was outstanding between the pipes. He won all three of his starts, keeping the Blackhawks competitive in games where defensive coverage broke down. Given the volume and quality of chances he faced, his performance was one of the main reasons the record was not worse.
Greene quietly had a strong stretch as well. He finished with 5 points and was the only player with a positive plus-minus (+2) during this span. In a segment defined by defensive issues and blowouts, that stands out significantly and reflects reliable two-way play.
Frank Nazar also deserves recognition. He posted 6 points, all assists, showing improved playmaking and offensive awareness, even though the team struggled to finish consistently.
Players Impacted by the Stretch
On the other side, several players were hurt by the nature of this segment.
Ilya Mikheyev had a difficult 10 games, finishing with 0 points and a –9 rating. Much of that damage came during the blowout losses, but the lack of offensive impact stood out, especially for a player relied upon for transition and puck support.
Arvid Söderblom also faced a challenging stretch, posting a 6.71 goals-against average in three games. Context matters here — he was on the ice during some of the worst defensive performances of the season, where high-danger chances against were overwhelming.
Overall, many players finished in the negative due to three blowout losses, which skewed plus-minus numbers across the lineup. This was not an individual failure as much as a team-wide defensive collapse, particularly on the road.
Overall Takeaway
The last 10 games highlighted a clear divide: a small core of players continued to perform and lead, while others were dragged down by poor structure, defensive-zone breakdowns, and game flow spiraling out of control. With the recent coaching adjustments and lineup changes, this stretch should serve as a reference point — not a definition — of where this team is heading.
Coaching Evaluation: Last 10 Games Jeff Blashill (B-)
Looking strictly at the numbers, the last 10 games were clearly the most difficult stretch of the season. The team finished 3-5-2, allowed nearly four goals per game, and saw sharp drops across multiple performance indicators, including shot quality, high-danger chances, and overall structure. That reality matters when evaluating coaching performance — but context matters just as much.
Managing a Collapse, Not Creating One
The analytics show that the defensive issues were not subtle. The Blackhawks were heavily outmatched in high-danger chances, spent extended time defending, and struggled badly on the road. These trends point more toward execution breakdowns and roster limitations than a system failure.
Where the coach deserves credit is in how he responded, not in pretending the stretch never happened.
After a blowout road weekend, adjustments were made quickly:
- Shift from 7 defensemen to a traditional 6-defense setup
- Return from 11 forwards to 12 forwards, restoring line stability
- Clear effort to simplify the game and protect the middle of the ice
The immediate result was a shutout win against the Rangers, which strongly suggests the adjustments were effective and timely.
Personnel Decisions: Tough, But Logical
Sending Sam Rinzel and Landon Slaggert to Rockford was not a punishment move — it was a development and structure decision.
The numbers show:
- Too many defensive-zone breakdowns
- Inconsistent puck management
- Young players being put in difficult situations during a rough stretch
Rather than letting confidence erode at the NHL level, the coach chose to:
- Reduce chaos
- Stabilize matchups
- Let younger players reset in a more controlled environment
That reflects long-term thinking, not short-term panic.
Special Teams & Structure
Special teams results during the stretch were mixed:
- Power play regressed, failing to create momentum
- Penalty kill held firm, remaining competitive despite the team spending more time defending
This suggests the coaching staff maintained structure where possible, even while five-on-five play suffered.
Overall Coaching Grade (Last 10 Games)
Grade: B-
Why not lower?
- Adjustments were made quickly
- The team responded immediately
- Defensive structure improved post-change
- Development decisions were proactive
Why not higher?
- The team lost control of game flow for too long
- Road structure collapsed before corrections came
- Shot quality and slot coverage deteriorated significantly
This was not a coach who lost his room or failed to react. This was a coach dealing with a young roster, a brutal road stretch, and poor defensive execution — and who adjusted when the numbers demanded it. The response matters, and the Rangers shutout showed that the message landed.
The next 10 games will determine whether these changes stick — but based on the data, the coach did what was required at the right time.
Final Thoughts
This 10-game stretch was less about effort and more about exposure. The numbers, the results, and the game flow all point to the same conclusion: when structure slipped—especially on the road—the margin for error disappeared quickly. Blowout losses magnified weaknesses, dragged down individual metrics, and forced the team into chase mode far too often.
At the same time, this stretch also clarified who the team can lean on. The top players continued to drive offense, goaltending kept games from getting out of hand more often than not, and recent tactical adjustments showed that the group can stabilize when the message is simplified. That matters.
This was not a collapse of identity, but a reminder of where the team still sits in its development curve. Young rosters are fragile under pressure, and this segment showed how quickly games can unravel when details slip—slot coverage, puck management, and road discipline in particular.
The response will define the next phase. With lineup changes, a return to a more traditional setup, and clearer roles, the Blackhawks now have a chance to reset. The challenge isn’t to erase this stretch, but to learn from it—because the teams that take the next step are the ones that turn difficult segments into reference points, not recurring problems.
The direction remains clear. The execution must follow.
KEEP READING:
Blackhawks Weekly Recap: (Week 1)
Blackhawks Weekly Recap (Week 2)
Blackhawks Weekly Recap (Week 3
)Blackhawks Weekly Recap (Week 4)
Blackhawks Weekly Recap (Week 5)
Blackhawks Weekly Recap (Week 6)
Blackhawks Week in Review:Week 7
Blackhawks Week in Recap (Week 8)
Blackhawks Week In Review: (Week 9)
Blackhawks October Report Card
Blackhawks: November Report Card


I appreciate all the hard work and detail you put into these reports. It’s a great breakdown of the Hawks play.
The overall record would be better once they learn how to win the close games. As you started 11 games lost by a single goal, 6 in OT. Hopefully, that winning culture will develop over this year and beyond.
With that said, If Bedard is out for an extended period, the onus to dig deeper and win those close ones will fall on others’ shoulders. Good time for the likes of Nazaer, Moore, Greene and Lveshunov to step up and take charge in Bedard;s absence.
Thanks for your comment—and for the kind words about the report. I really appreciate your input.
You’re absolutely right about all those one-goal games. With a young team, learning how to close out tight games is a big part of the process. That’s why I always say it’s so important for these guys to play meaningful games—they need those situations to build a winning culture and take the next step in their development.
Of course, it’s disappointing to see Bedard injured, but it also opens the door for others to step up. This is a great opportunity for guys like Nazar, Moore, Greene, Levshunov and the rest to elevate their game and take on more responsibility while Bedard is out.
Bon match ce soir!