Setting the Stage
The NHL salary cap is on the rise again. For the first time in years, we’re not just talking about flat caps or small bumps — we’re looking at a projected climb from $95.5M today to around $170M in 2034–35.
That’s a massive increase. And with it, the way we evaluate contracts is changing. For years, fans and media focused only on the dollar number — 10 million, 12 million, 15 million. But what really matters is the cap percentage (cap %)a player takes from the team’s payroll.
Right now, the best of the best — Connor McDavid, Leon Draisaitl, Auston Matthews — sit around 13–15% of the cap. That’s the real baseline for what an elite, franchise-changing player costs in today’s NHL.
But if the cap grows the way we expect, those numbers are going to look very different in the near future. To show this, we built three tables that tell the story:
- Cap Projection to $170M
- Contracts Cap % for Nazar, Knight, Vlasic
- Bedard AAV Targets at 12–9%
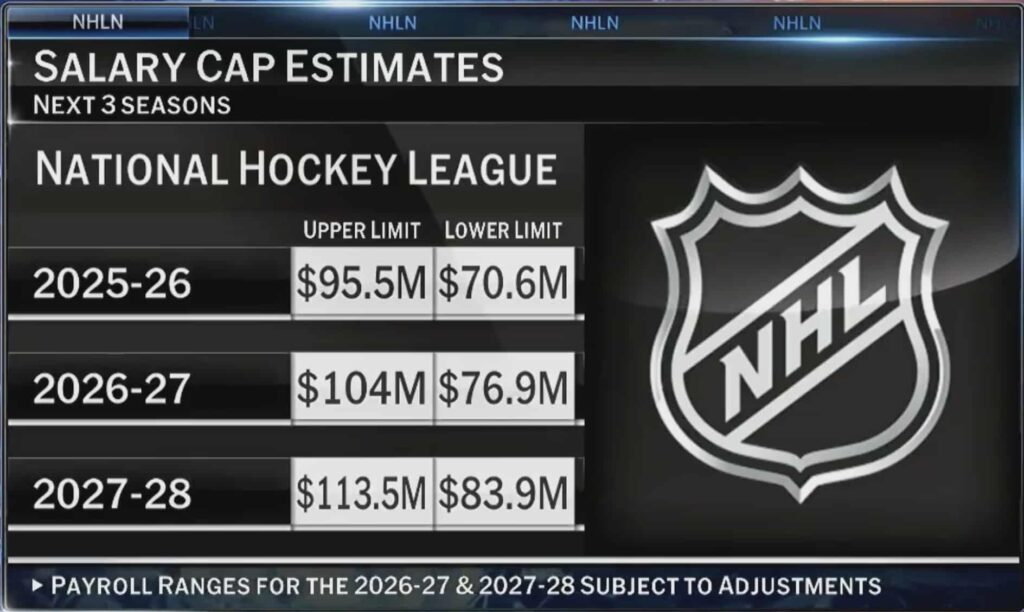
Table 1: NHL Cap Projection to $170M
The first table projects the NHL salary cap from $95.5M today to $170M in nine years — an increase of about $8.3M per year.
This isn’t just guesswork. People close to the NHL — league executives, agents, and insiders — believe this is a realistic path for the cap in the next decade, especially with revenues growing from TV deals, international tournaments, and expanded markets.
If that holds true, the landscape for contracts will look very different by the early 2030s.
Table 1: NHL Cap Projection
| Year | Cap ($M) | 20% of Cap ($M) | 8M % | 10M % | 12M % | 15M % | 17M % | 20M % | 22M % | 25M % | 30M % |
|---|---|---|---|---|---|---|---|---|---|---|---|
| Year 0 (now) | 95.5 | 19.10 | 8.38% | 10.47% | 12.57% | 15.71% | 17.80% | 20.94% | 23.04% | 26.18% | 31.41% |
| Year 1 | 104.00 | 20.76 | 7.71% | 9.63% | 11.56% | 14.45% | 16.38% | 19.27% | 21.20% | 24.09% | 28.91% |
| Year 2 | 113.5 | 22.70 | 8.63% | 8.80% | 10.60% | 13.06% | 15.08% | 17.61% | 19.51% | 22.21% | 26.68% |
| Year 3 | 120.33 | 24.07 | 6.65% | 8.31% | 9.97% | 12.47% | 14.13% | 16.63% | 18.29% | 20.79% | 24.94% |
| Year 4 | 128.61 | 25.72 | 6.22% | 7.78% | 9.33% | 11.67% | 13.22% | 15.56% | 17.11% | 19.45% | 23.33% |
| Year 5 | 136.89 | 27.38 | 5.84% | 7.30% | 8.76% | 10.95% | 12.42% | 14.61% | 16.07% | 18.27% | 21.90% |
| Year 6 | 145.17 | 29.03 | 5.51% | 6.89% | 8.27% | 10.34% | 11.71% | 13.78% | 15.16% | 17.22% | 20.67% |
| Year 7 | 153.44 | 30.69 | 5.21% | 6.52% | 7.82% | 9.77% | 11.08% | 13.04% | 14.34% | 16.29% | 19.55% |
| Year 8 | 161.72 | 32.34 | 4.95% | 6.20% | 7.44% | 9.29% | 10.51% | 12.38% | 13.60% | 15.46% | 18.55% |
| Year 9 | 170.00 | 34.00 | 4.71% | 5.88% | 7.06% | 8.82% | 10.00% | 11.76% | 12.94% | 14.71% | 17.65% |
Official NHL salary cap estimates for the next three seasons (via NHL Network).
These numbers line up with the upward trend shown in Table 1, and many insiders believe the cap could climb as high as $170M within the next decade.
What This Projection Really Shows
A $10 million contract today takes up 10.5% of the salary cap. By 2034–35, if the cap rises as projected, that same $10M deal would count for just 5.9% of the cap.
This is the core reason teams and agents watch cap percentage rather than just dollars.
- For players: locking in early guarantees stability, but they risk losing ground if the cap jumps. A deal that looks massive today quickly shrinks in relative weight.
- For teams: long-term contracts can actually become bargains if the cap keeps climbing, since the % hit on the roster decreases over time.
- For negotiations: this explains the current “waiting game.” Elite players like McDavid, Kaprizov, and Eichel are holding out for higher cap % benchmarks (16–18%), knowing that contracts tied to today’s dollars may look undervalued in only a few years.
In other words, the dollars don’t tell the full story — the percentage does.
Why are some numbers in bold?
Those figures represent cap hits that would be above 20% of the team’s salary cap. Under the current NHL Collective Bargaining Agreement (CBA), no player can exceed that threshold in any given season.
So while the table shows those higher percentages for context, they are not possible in practice. The maximum any player can sign for is 20% of the cap — which is why today’s ceiling is $19.1M, and in 2034–35 it would be $34M if the cap hits $170M.
Table 2: Chicago’s Core — Nazar, Knight, Vlasic
The second table applies this logic to three Chicago Blackhawks players.
Table 2: Chicago Contracts (Cap %)
| Player | Present 2025–26 | Year 1 2026–27 | Year 2 2027–28 | Year 3 2028–29 | Year 4 2029–30 | Year 5 2030–31 | Year 6 2031–32 | Year 7 2032–33 | Year 8 2033–34 | Year 9 2034–35 |
|---|---|---|---|---|---|---|---|---|---|---|
| Frank Nazar | 0.99% | 6.91% | 6.43% | 6.01% | 5.64% | 5.32% | 5.03% | 4.78% | N/A | N/A |
| Spencer Knight | 4.71% | 6.12% | 5.70% | 5.35% | N/A | N/A | N/A | N/A | N/A | N/A |
| Alex Vlasic | 4.82% | 4.82% | 4.48% | 4.20% | 3.96% | N/A | N/A | N/A | N/A | N/A |
What These Numbers Tell Us
- Frank Nazar: His jump from an entry-level $950K to a $6.6M AAV looks big today, but the rising cap means his deal steadily shrinks in weight.
- By Year 7, it’s only 4.8% of the cap — essentially middle-six money for a player who could be a top-six centerpiece. If he develops as expected, this becomes a huge bargain.
- Alex Vlasic: His $4.6M looks fair at 4.8% of today’s cap, but by Year 4 it drops to just 3%. That’s bottom-pair cost for a top-four defender, giving Chicago cost-controlled stability on the blue line.
- Spencer Knight: The three-year bridge at $5.83M (about 6% now) buys time for both sides.
- Chicago protects itself if Knight doesn’t solidify as a starter, but if he does, they’ll need to pay up once his percentage leverage climbs with the next deal.
The key lesson: contracts that look heavy in the present quickly age into value deals as the cap expands.
For a rebuilding team like the Blackhawks, these structures give GM Kyle Davidson room to build around Bedard without being crushed by early deals for the supporting cast.
Table 3: Connor Bedard’s AAV Targets
Now the big one — Connor Bedard. If he has a breakout season, what will his next contract look like?
We ran the numbers to calculate AAVs if Bedard signs for 12%, 11%, 10%, or 9% of the cap, across 4–8 year terms, starting in 2026–27.
Bedard AAV Targets Table (Summary)
| Term | 12% AAV ($M) | 11% AAV ($M) | 10% AAV ($M) | 9% AAV ($M) |
|---|---|---|---|---|
| 4 years | 11.2 | 10.2 | 9.3 | 8.3 |
| 5 years | 12.1 | 11.1 | 10.1 | 9.1 |
| 6 years | 13.0 | 11.9 | 10.9 | 9.8 |
| 7 years | 14.0 | 12.8 | 11.7 | 10.6 |
| 8 years | 15.1 | 13.8 | 12.6 | 11.3 |
What This Means for Connor Bedard
- A 4-year deal at 12% = ~$11.2M AAV. That would give Bedard big money quickly but also leave him hitting UFA status again while still in his prime, with the chance to cash in on a much higher cap.
- An 8-year deal at 12% = ~$15.1M AAV. This locks him in long-term as the franchise centerpiece. It’s security for both Bedard and the Blackhawks, but it could look “cheap” in percentage terms halfway through the deal if the cap keeps climbing.
- Bridge vs. Long-Term. The big debate is whether Bedard signs a bridge deal (3–4 years) or goes straight to a long-term extension (6–8 years).
- A bridge would mirror the path we’ve seen with stars like Matthew Tkachuk or William Nylander, who bet on themselves and later landed bigger second contracts.
- A long deal would be more like Jack Hughes or Tim Stützle — players who locked in early at cap % numbers that now look like bargains.
- The Waiting Game. Bedard’s camp will be watching McDavid, Kaprizov, and Eichel, all of whom are eyeing 16–18% cap deals. Bedard isn’t at that level yet, but if he posts 80+ points this season, he’ll likely push into the 10–12% range. That puts his first major deal somewhere between $10M and $12M AAV even on a bridge — and closer to $13M–$15M AAV on a long-term pact.
The 20% Max Rule
Under the CBA, no player can exceed 20% of the cap in a given season.
- Today: 20% of $95.5M = $19.1M.
- By 2034–35: 20% of $170M = $34M.
McDavid signed closest to this at 16.7% when his deal was announced. That’s why agents are pushing — because the ceiling is going up, and they want stars paid closer to their actual market value.
The Waiting Game
So why are McDavid, Kaprizov, and Eichel sitting on their hands?
Because the first big signing sets the market. Agents and players know that the elite want to push cap % higher — not just 13–14% like today, but up to 16–18% or more.
In fact, Kaprizov’s agent said recently they want a cap % close to that 16–18% range.
That’s the leverage game. But for Connor Bedard, it’s different. He can’t use McDavid or Kaprizov as a benchmark yet because he hasn’t reached that level.
Still, if he has a strong season, you can bet his camp will aim to get close to 12% of the cap — not McDavid money, but a number that reflects his potential as the league’s next superstar.
The Coming Shift
Here’s the reality:
- Bedard’s bridge deal → If he hits 80 points this season, he’s looking at $11–12M on a short-term bridge contract.
- Bedard’s long-term deal → On a 6+ year contract, the number will likely land at $10M or more.
- Forget anything under $10M → If Bedard performs, there’s no chance he signs for single digits. His floor is double-digit millions if his production matches the hype.
The rest of the league will follow. Other young stars — Fantilli, Carlsson, Hughes, Hutson — will all measure themselves against that. And once the super-elite push for 16–18% cap hits, the landscape changes.
Final Thoughts
When you study contracts today, don’t just look at the dollar value. Look at the cap %. That’s the real number that matters.
- Table 1 showed us the cap climb and how % shrinks over time.
- Table 2 showed us how Chicago is building smart with Nazar, Knight, and Vlasic.
- Table 3 showed us the Bedard question: 4 years vs. 8 years, 12% vs. 10%.
At the end of the day, the best players in the league should land between 11–14% of the cap. If Bedard has a monster season, he’ll be right there.
The turnover is coming. $20M contracts will arrive. $25M won’t be far behind. And fans need to be ready — because the NHL salary system is about to look very different in the next decade.